
The SQA2 Blog: Performance Testing
Most teams know their application works. Fewer know how it behaves when a large crowd arrives at the same moment, or when a promotion sends ten times the usual traffic in seconds. Performance testing answers those questions before your customers do. At SQA², we treat a slow response time as a symptom. The goal is to find the root cause behind it, such as a missing database index or a chatty service call, and resolve it permanently.
Isolated Environments and Real World Scenarios
Testing against a nearly empty database or a shared development server creates false confidence. Data volume and environment noise change how a system behaves. We execute load from dedicated remote Linux machines against isolated environments populated with varied test data to prevent artificial cache hits. This ensures that any latency spike or resource constraint is strictly the result of the load profile, not cross-contamination from other team activities.
We build testing complexity in two primary phases:
- Individual API Benchmarking: Isolating single endpoints to measure raw efficiency and locate exact breaking points.
- Day in the Life Workflows: Chaining interconnected APIs into end to end user journeys, complete with realistic think times between actions to replicate actual human behavior.
The Six Cycle Methodology
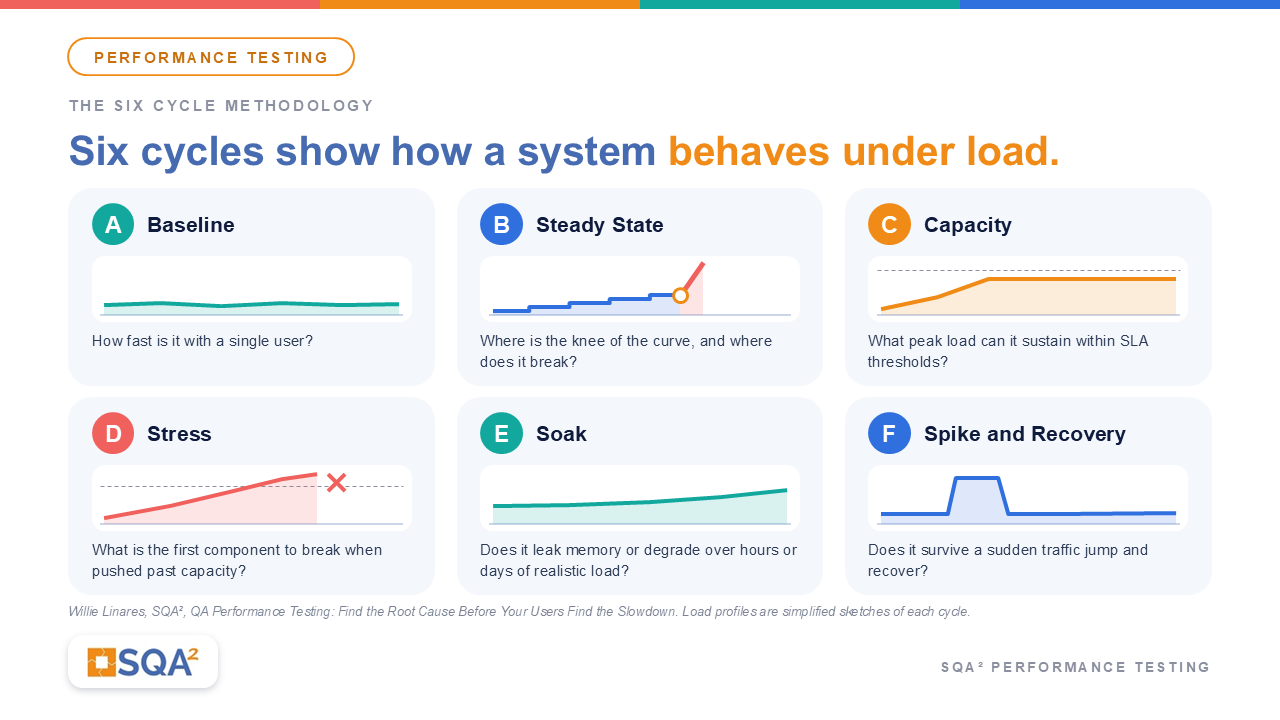
Performance testing is a family of tests where each cycle answers a specific operational question. A team that runs only one type of test only gets one answer. Our staged methodology characterizes system behavior across six distinct cycles:
- Cycle A (Baseline): Single-user pacing to establish clean performance measurements before applying heavy load.
- Cycle B (Steady State): A stepped load test that gradually increases Requests Per Second (RPS) to find the knee of the performance curve and the absolute breaking point.
- Cycle C (Capacity): Sustained peak load using the highest clean step from Cycle B to confirm maximum sustainable throughput within SLA thresholds.
- Cycle D (Stress): Deliberately pushing the system past capacity to document failure behavior and identify the first component to break.
- Cycle E (Soak): Extended endurance testing under realistic load to expose memory leaks, connection pool exhaustion, and slow resource degradation that short runs miss.
- Cycle F (Spike and Recovery): Sudden, massive traffic jumps followed by recovery windows to validate resilience during flash sales, ticket drops, or enrollment deadlines.
Report Percentiles, Not Averages
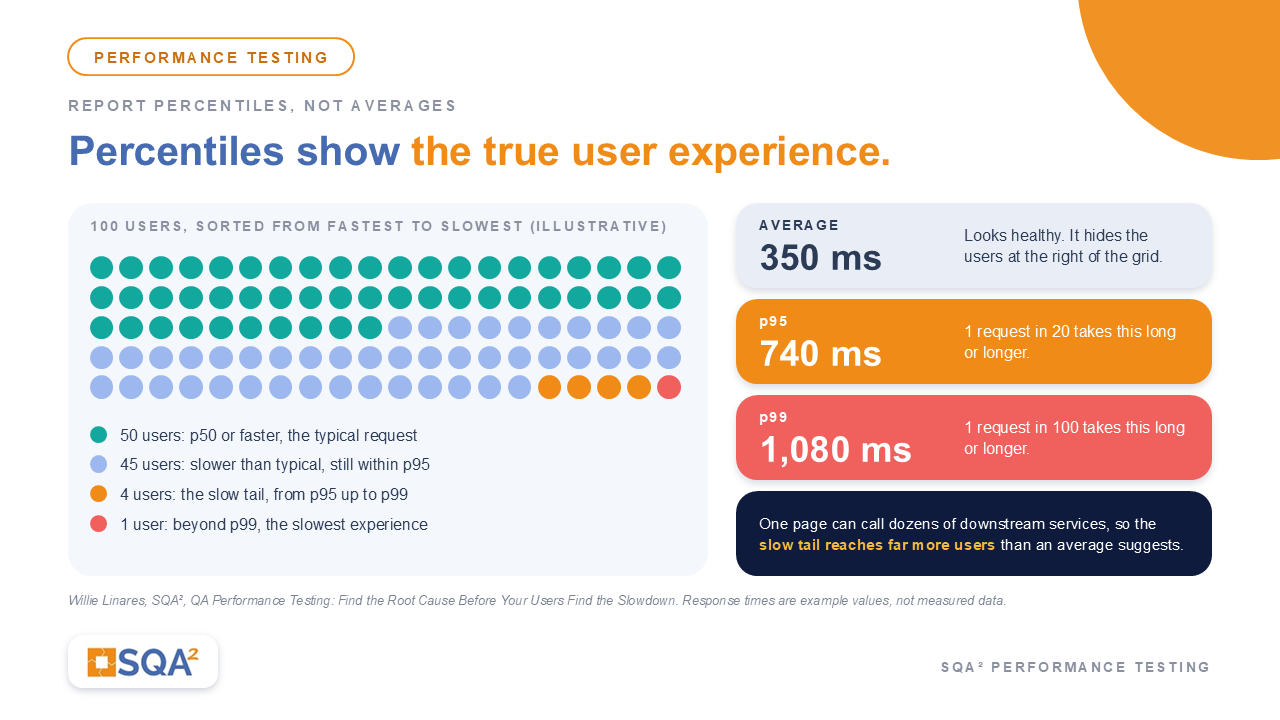
An average response time can look healthy while a meaningful share of users wait far too long. Percentiles show the true user experience: p50 describes the typical request, while p95 and p99 capture the slowest experiences. Modern applications call dozens of downstream services to load a single page, meaning the slow tail impacts far more users than an average suggests.
Eliminate Bottlenecks Early and Use AI Wisely
Performance drift compounds quietly. A 3% slowdown in each release goes unnoticed in a single sprint, but adds up to a major degradation over a year. When a test reveals latency, profiling and tracing pinpoint the underlying culprit, whether that is a full table scan or an undersized connection pool. Once fixed, adding automated performance gates to the build pipeline ensures that drift never returns.
AI accelerates this process by analyzing telemetry from early baseline and step cycles to suggest target RPS numbers and flag potential breaking points. However, human judgment remains essential. Our engineers validate those thresholds, configure SLA guardrails, and interpret the final architectural impact.
How SQA² Approaches It
At SQA², our Quality Engineers build performance into the test strategy from day one. Working directly inside your delivery team through Embedded QA and Software Quality as a Service (SQaaS), we ensure your team knows exactly how its system behaves under pressure before your customers ever find out.